DIY Virtual Reality Treadmill: Leadville 100 Powerlines Climb
In one form or another, I’ve had this idea rattling around my noggin for several years. Take GPS data from a run and follow along in Google Earth as you run on a treadmill. This is not a unique thought, there are many indoor devices that will do similar things. CompuTrainer and Tacx make bike trainers that adjust the resistance while you follow a route on a computer screen, and Nordic Track makes a treadmill that automatically adjusts the incline as you go along. Very cool stuff, and I would love to have any of them. Trouble is, they will set you back anywhere from $1,000 to $2,000. That’s where the DIY part comes in.
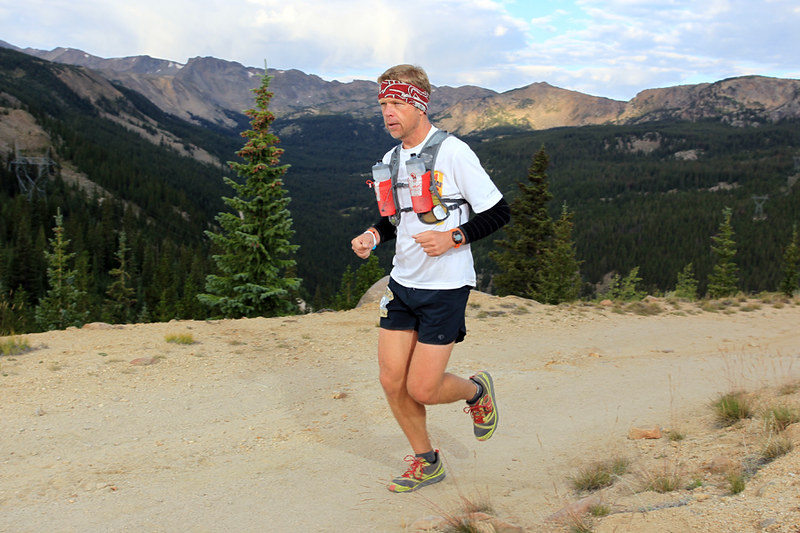
I thought that I could come up with something similar for FREE, assuming you already have access to a treadmill. The other aspect I like is that this is based on a real run. The data came from the 2010 Leadville annual group night run. We started at Fish Hatchery (mile 77 of the race course) and ran the final 23 miles to the finish.
For this task, I took the data from the start at FH and clipped it off a little over 5 miles later at the top of the Powerlines climb.
Why Powerlines? Why not use the more dramatic Hope Pass for this instead?
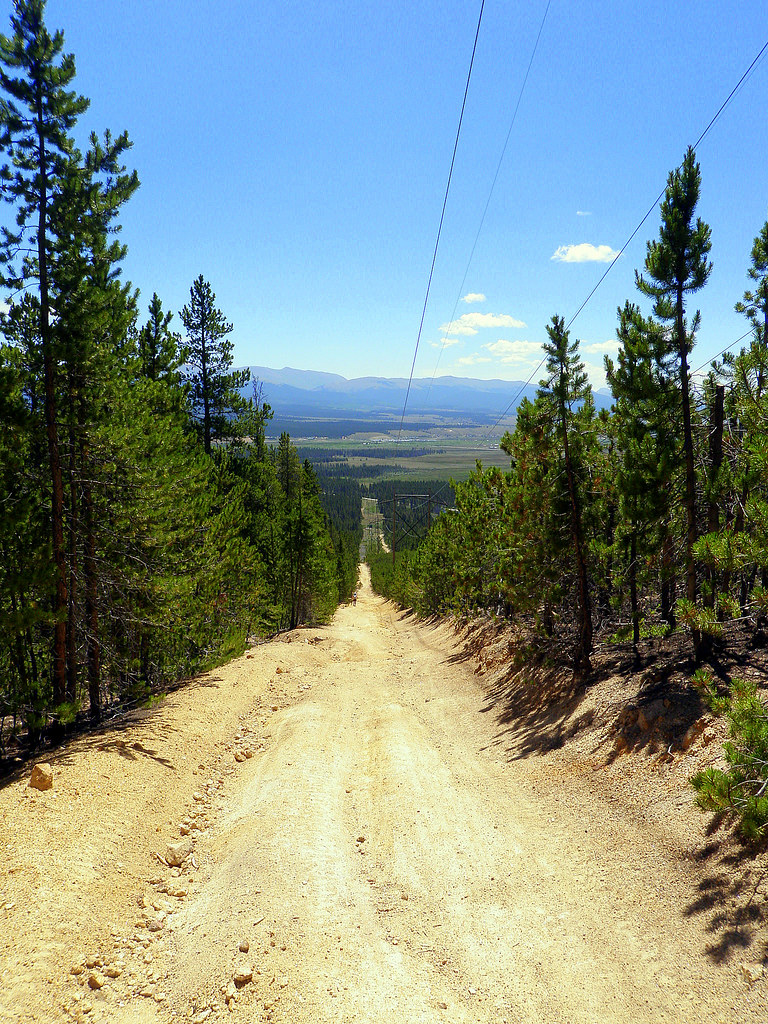
There are so many iconic climbs to choose from. Most of them get their reputations because they are long and steep. To simulate Hope Pass, you can just max out the incline on your treadmill and go. That’s all there is to it. Powerlines was well suited to the DIY VR concept because it has a lot of variety. There are several downs mixed in with the ups, and the grades vary from mild to very steep keeping things mixed up very nicely and make for a more engaging experience.
Using SportTracks, which has the ability to create splits after the fact, I was able to zero in on the individual high points of the route. Then I calculated the average gradient for each section, along with the average speed.

Then I took that data and did many test runs with paper printouts that would prompt me when to change speed and incline. I kept a pen handy as there were several small tweaks to be made in order to smooth things out a little and make it all flow better.

That was followed by more number crunching in Excel. Toying with universally faster paces to see how it all felt.

In total, I worked on and off for two months to get things dialed in. With the help of some GPS track playback software, I recorded the base footage along with an elevation graph that fills in as you go.

The basic idea being to crank up some of your favorite tunes, start the YouTube playback, and hop on the treadmill to follow along. It will prompt you along the way to change incline and speed.

I had a little fun with the speed graphic. Ketchup represents the actual speed recorded on that run back in 2010. Then the various Taco Bell hot sauce packs (mild, hot, fire) represent 10%, 20%, and 30% increases. That way, you can pick a level and stick with it for the duration.

I took care to arrange the speed and incline prompts in the optimal order. I quickly learned that it wasn’t fun to ramp the speed up while you were still climbing at 15%. Better to drop the incline, then speed up. When you are going over the top of the false summits, it almost feels like you are really going downhill.
Even though there are grades as high as 22%, I chose to cap this at 15%. That is as high as my treadmill will go. If yours will only do 10% or 12%, just hit that when you see the 15.
You can always speed up or slow down if you don’t like one of the preset options. If you stick with the incline changes, just track your ending mileage to see improvement and work to run a little faster (which doesn’t speed up the video, but will result in going further on the treadmill) over time.
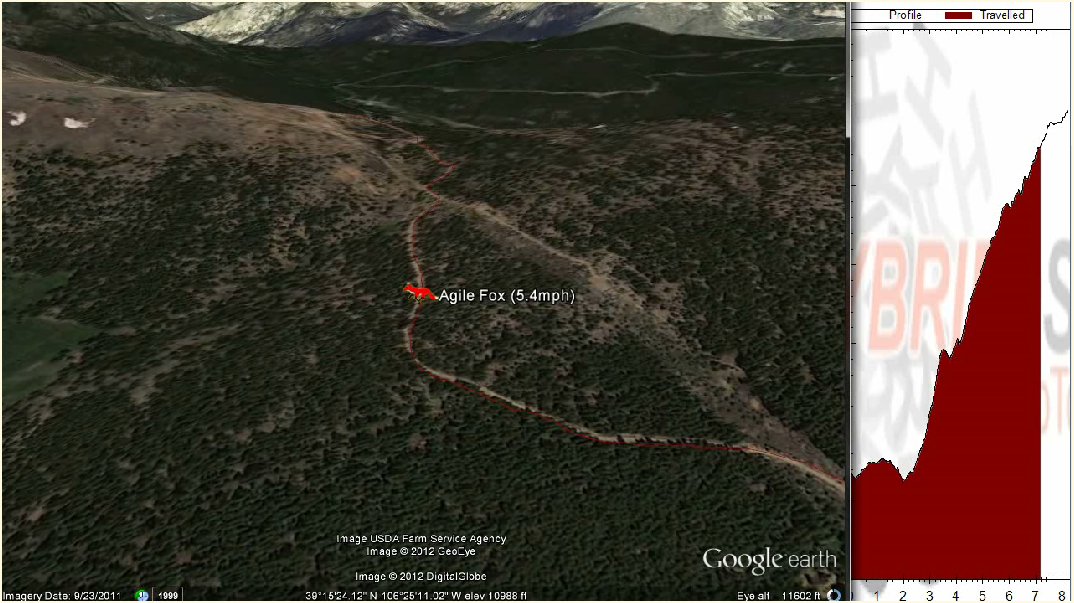
The scale at the bottom of the elevation profile represents kilometers.
Now that the Front Range of Colorado is buried under a few feet of snow, it seemed like the perfect time to finish this up and get it out there. I hope you find it enjoyable and I’ll see you in Leadville this summer!
Disclaimer: The real climb is a LOT more difficult than running on some treadmill…
Have fun!
Posted on February 4, 2012, in run. Bookmark the permalink. 10 Comments.


Haha! I have done this same sort of game with the Barr Trail at Pikes. Fun stuff. In a warp really painful sort of way. Good on ya. Particularly with these great running conditions we have the last couple of days.
Yeah, kinda geeky. Perfect for a day like today. I was thinking Barr Trail would be a good one to do as well.
this is pretty awesome. i’ll have to pick your brain a bit about how you set this all up.
Thanks, Andrew. It’s really simple in some ways, but got complicated in others. Glad to share the tale when you want to hear about it.
You are taking this stuff to a new level, very cool. I wonder if soon there will be treadmills that you can load GPX tracks into? I’m not really up on my treadmill tech.
I had to go download that software after seeing the Google Earth tracking. I’m going to have some fun with that, thanks!
I have to admit I look pretty slow from several hundred feet in the air
There is a Nordic Track treadmill that lets you follow routes in Google Maps. I’m not too sure if you are actually importing a .gpx file or using some other means.
That tracking software is pretty cool. You can relive a whole trip that way in slo-mo!
This is awesome Chris. Now I just need a treadmill. Ours broke in December. I’m drooling over the NordicTrack Incline Trainer x9i, but it’s a little pricey for me.
Thanks, Woody. Yeah, that x9i is sweet. Definitely what I had in mind when working on this, as it will take a while to wear out my current treadmill and justify an upgrade. Now we just need to connect them all together and do our group runs over the internet! Hmmm….
Follow-up – You probably noticed this, but you can load two or more gps tracks and run them at the same time – virtual race. I went and sprung for the $20 fee to get that… otherwise the second track only runs 30 seconds and then resets to the beginning.
I compared one of my runs up Green in Boulder against someone faster, to see where I was falling behind. A: the flat sections.
Cool! I hadn’t looked at that feature, it definitely opens up some possibilities. Using it to compare Green times is an excellent example. Good stuff!
SportTracks had/has a plugin to do that as well. I used it to compare my 3 laps at a MTB race in Bear Creek a few years ago (bottom of this post):
https://thescenebegins.com/2009/05/09/race-report-battle-at-the-bear-mtb-singlespeed/
Come to think of it, the 50K I’m running this weekend is 3 laps as well. Should make for some interesting data to play with.